Trusted By Over 25 Million Users & Leading Brands

cmpa
mckesson
deloitte
amazon
facebook
apple
puma
nike
sony
pilz
ge
kpmg
fujifilm
mitsubishi_electric
ublox
daimler
toyota
walmart
harvard_university
glencore
at&t
amerisource_bergen
aramco
shell
total

Why EdrawMax to Make Your Charts and Graphs?

Visual representation of
your data
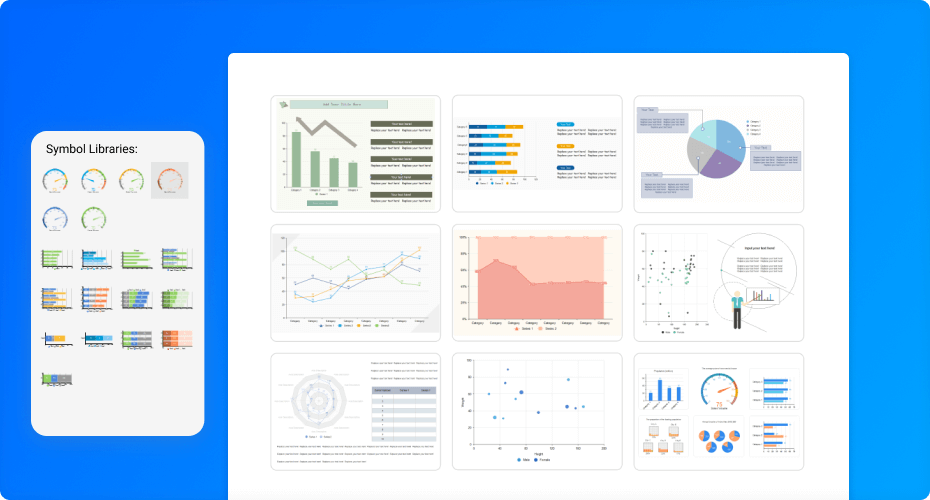
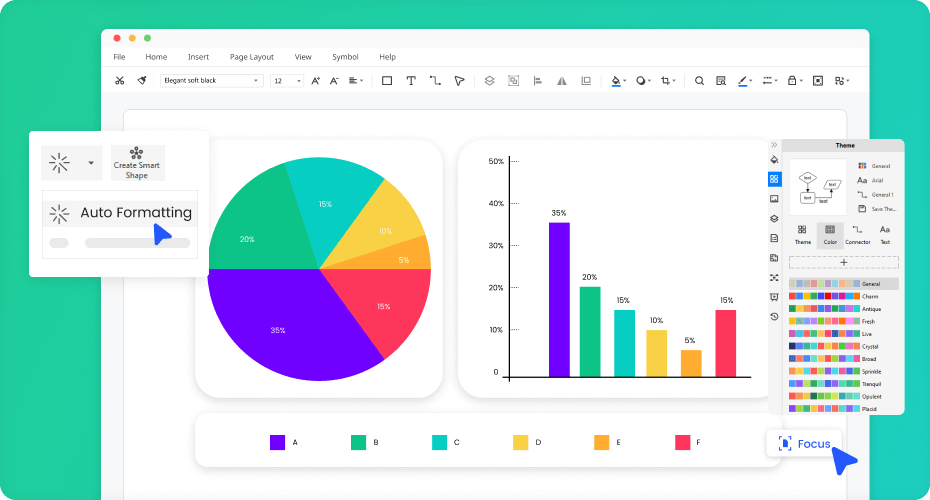
Simplification: Use charts and graphs to give a visual face to your data and observations to simplify interpretation and make conclusions easily. As they say, a picture is worth a thousand words, so graphs and charts can replace so many words.

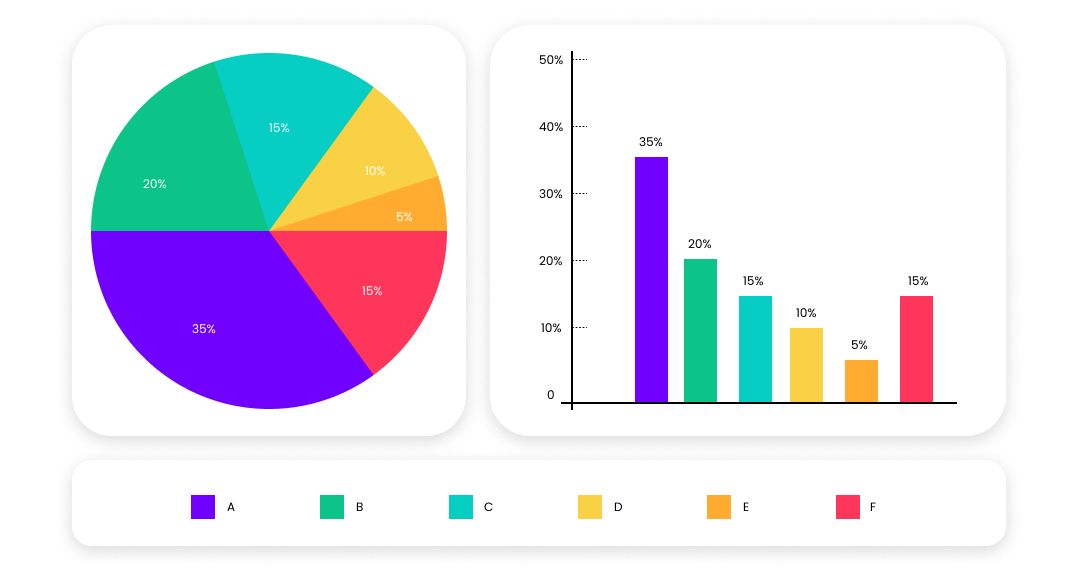
Tell a story: Being a teacher, you can concisely show your class traits with a pie chart without using hundreds of words.

Further exploration: Show the progress of your business with line graphs and show your journey of decades in one image.

for every need

Clicks away from
your success

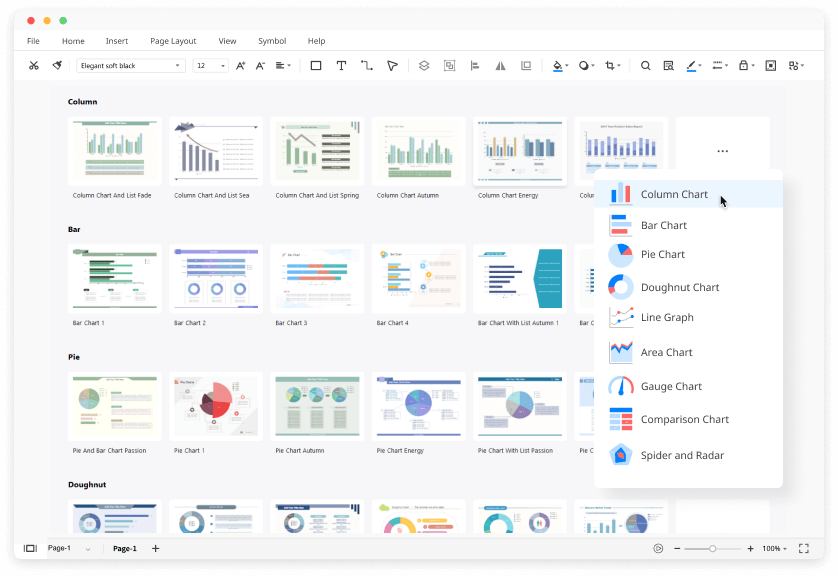
Abundant templates: Get a quick start with free and fully customizable designer templates. You can use these professional samples as a foundation and add your own data.

Create from data: Import data tables and Excel sheets into EdrawMax chart maker with a few clicks to convert them into visual graphs and charts.

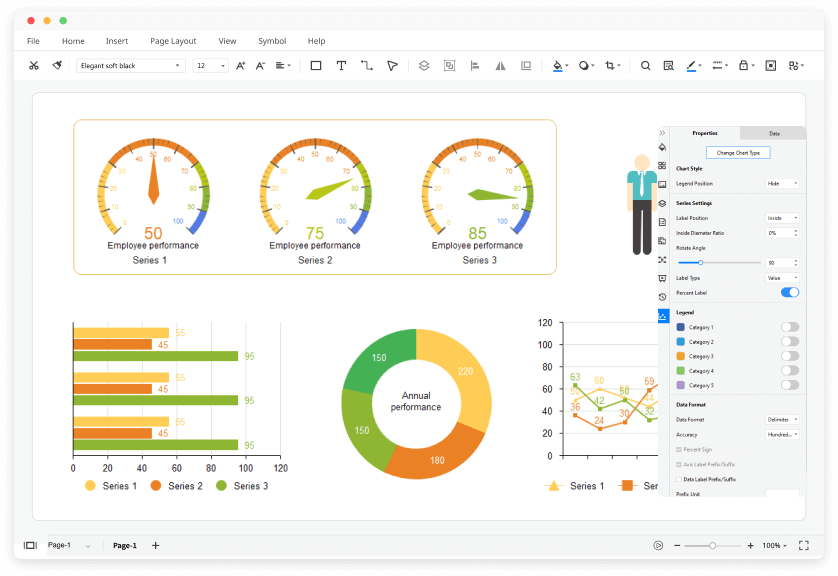
Easy changing and styling: Oh! I made a pie chart, but I think a waffle chart would have been better. Don't worry; Edraw chart maker allows you to convert between different charts without losing your data. You can also give your charts a professional and branding look with customized colors, fonts and styling elements.

create with EdrawMax

Share and embed
without limits

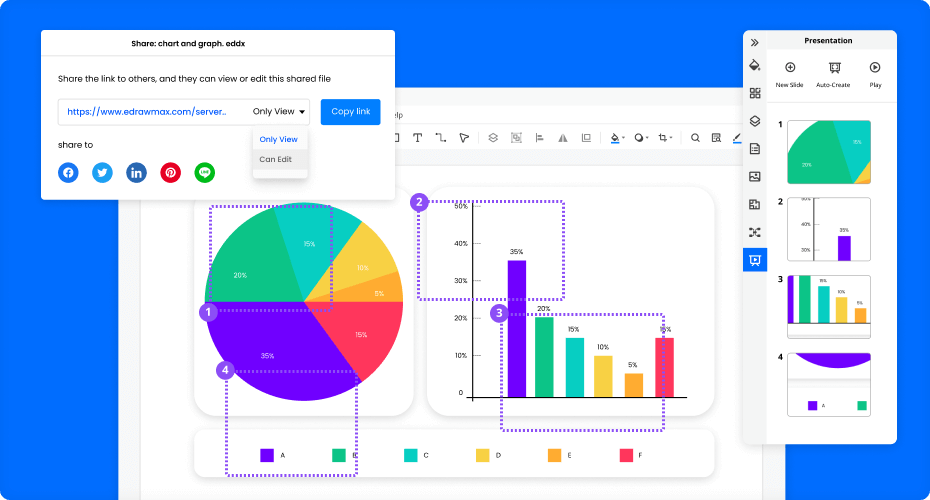
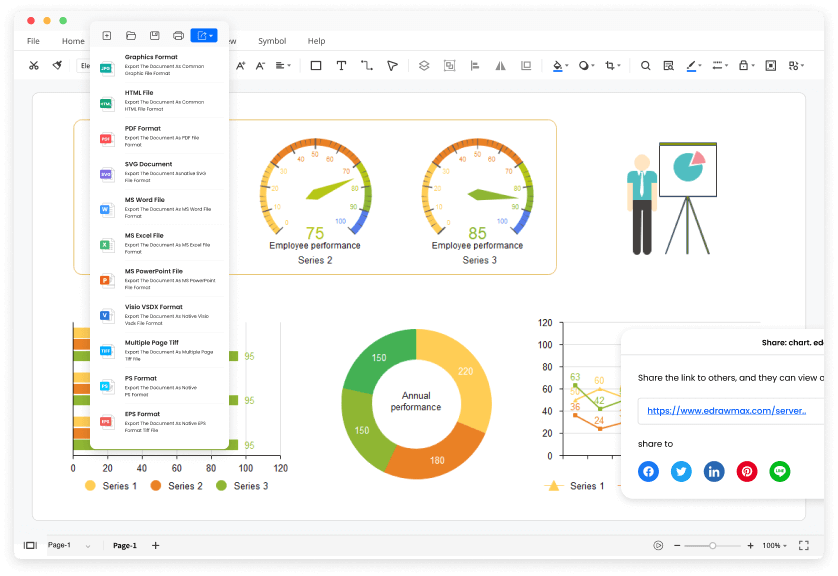
Post on social media: Do you want to show your work on social media? Simply use sharing links from within the EdrawMax chart maker.

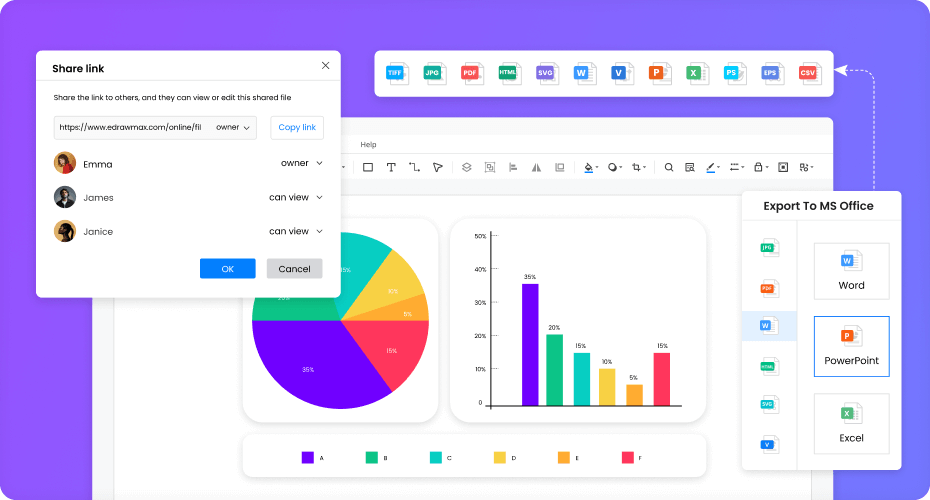
Export by choice: Sharing your work is easy with the export option. You can export in multiple popular formats, so compatibility is no excuse anymore.

Embed with no fuss: Also, embed charts and graphs in your infographics, presentations, reports, documents, and other diagrams drawn in EdrawMax. We support whooping 280+ diagram types.

collaboration

Present and print in style

Full screen: Why go to another application for presenting your work? Simply click F5 and go ahead with your full-screen presentation. Can it get easier than that?

Selected Slides: You can also select part of your work with a cursor and show only that part in your presentation slides.

Print with ease: Share your work in high-resolution charts and graphs with EdrawMax. Select your settings in the pop-up, and a simple click will do the job.

presentation

More Features Of Chart and Graph Maker

Visio files import and export
Customized fonts and shapes
Insert images and attachments
Infinitive canvas
Various color theme
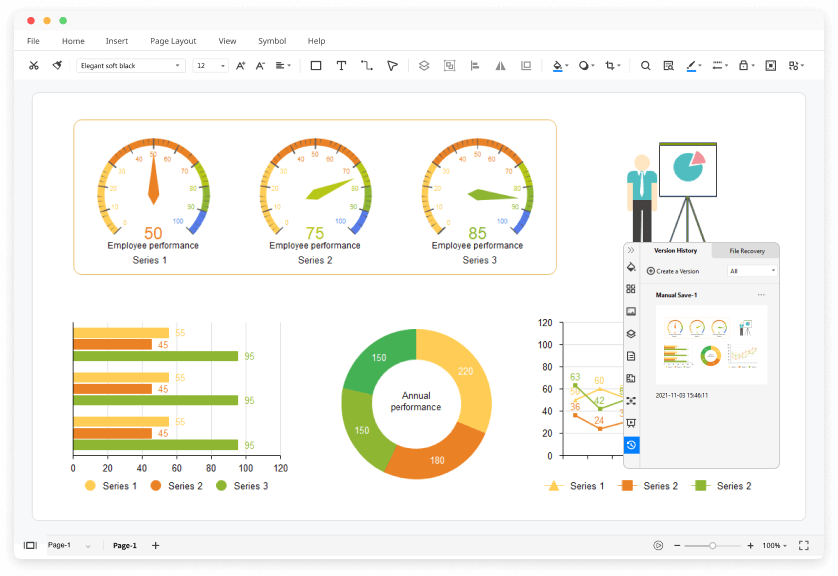
File encryption and file backup

EdrawMax has allowed me to bring new graphical elements to my charts and presentations. As a business analyst, this chart maker has saved my team and money by making the entire chart-making process easy. Compared to other complex tools, EdrawMax is less expensive and easier to use. It has made my process for creating charts better and even allowed my team to create artwork for my client’s business. The biggest advantage of this chart maker is a large number of templates it comes with and the different genres of templates.

I was introduced to Edraw because of its ease to use and the sheer amount of templates included. These templates are updated regularly, which makes my job as a project manager extremely easy. I started using this chart maker for work presentations as it has useful availability of libraries. From basic flow charts to high-end circuit diagrams, everything is there. There is no need to invest in multiple software as Edraw itself is enough for all the business-related drawings. Highly recommend it to everyone who is into chart making.

There are a lot of useful aspects of EdrawMax, but the best aspect of this chart maker is all the free templates that help in designing anything. This chart maker provides my team with a way to educate and inform a prospect in an easy viewing format. There is always a learning curve, but when you get the hang of the interface, you can start creating the charts in no time. The newly added templates are so amazing that it lets me create eye-catching charts for my clients.

Edraw Chart and Graph Templates

Histogram Example
Histogram Example
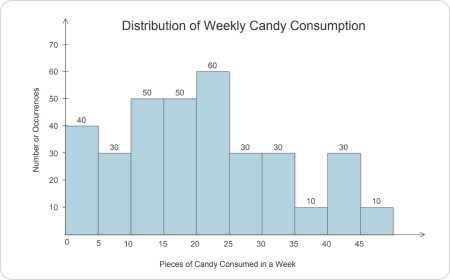
Histogram example is used for variables whose values are numerical and measured on an interval scale.
Bar Graph Example
Bar Graph Example
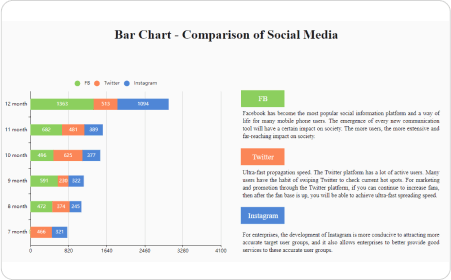
A bar graph template is a graph that represents the categorical data using rectangular bars.
Line Graph Example
Line Graph Example
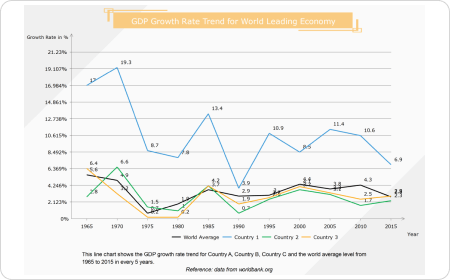
Line graph examples depict a graph that is used to display change over time as a series of data points connected by straight line segments on two axes.
Scatter Plot Example
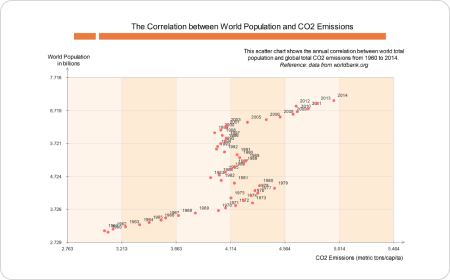
The scatter plot examples pairs of numerical data, with one variable on each axis, to look for a relationship between them.
Pie Chart Example
Pie Chart Example
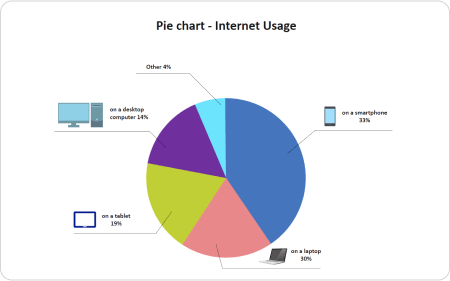
Pie chart examples show how pie charts are used in data handling and are circular charts divided up into segments, with each representing a value.
Comparison Chart Template
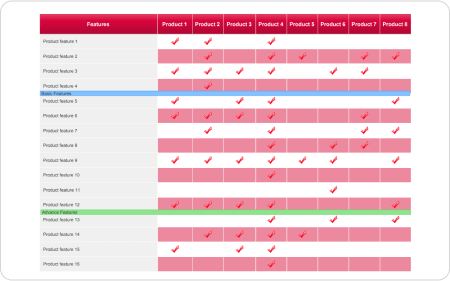
A comparison chart example is a chart that draws a comparison between two or more products on different parameters.

Chart and Graph FAQs

Except for the pre-made chart and graph templates in EdrawMax, you can download and customize chart and graph templates from our Template Community. All the community-made chart and graph templates are free to use for Edrawers.
When your chart is complete, you can post it on social media, publish on Edraw Template Community, or export the file as Word, Excel, PowerPoint, Visio, PDF, SVG, PNG and JPG. EdrawMax is dedicated to delivering a superior user experience.
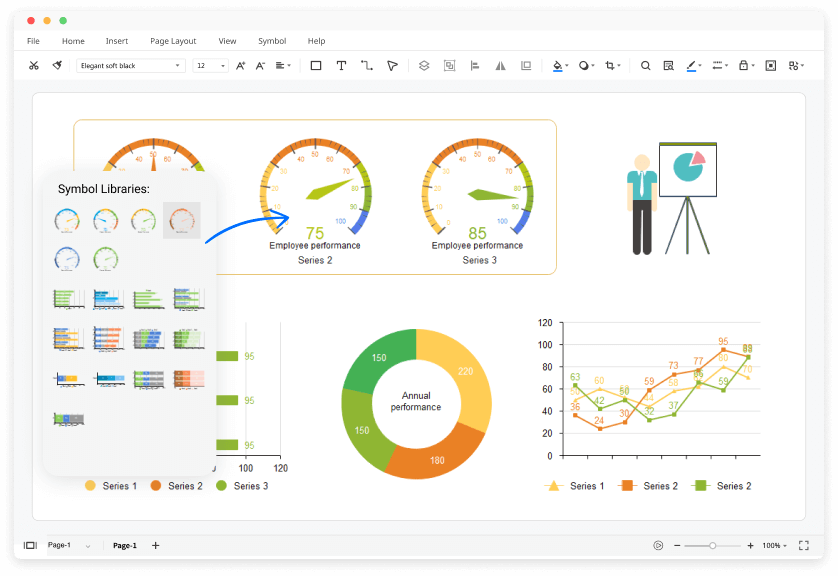
No worries. You can find chart and graph symbols by looking for "Graphs and Charts" in the long menu of symbol libraries. You will see all the pre-made genogram symbols in EdrawMax.
You can create a chart from scratch by dragging and dropping chart symbols from the libraries. Alternatively, you can navigate to the Insert tab and choose Chart. There you can select the chart that you like and add it into the canvas.
YES! It is free to create different charts and graphs in EdrawMax. There are free templates and symbols for making charts and graphs. Just download it and try EdrawMax now. You will love it right now.

More Resources

Unlock your diagram possibilities by exploring more diagram makers here.
Find more ideas, tips and knowledge to help create charts and graphs.
Need help? Find the instruction or contact support here.