A Beginner's Guide for Pedigree Chart
Edraw Content Team
Have you always been interested in the genetic study of both animals and humans? Do genetic diseases running in your family make you think often? Then a pedigree diagram is for you! Etching the same in your pastime will not just educate you about your earlier generation but also help you in a genetic study.
What is a Pedigree Chart?
While Wikipedia defines pedigree charts as a simple diagram depicting the phenotypes of a specified organism along with its ancestors, in layman language, it’s a perfect way to analyze inheritance patterns and traits running through a family. Though it appears much like a family tree in structure and form, in reality, it’s a working document covering hereditary diseases and similar other areas of study.
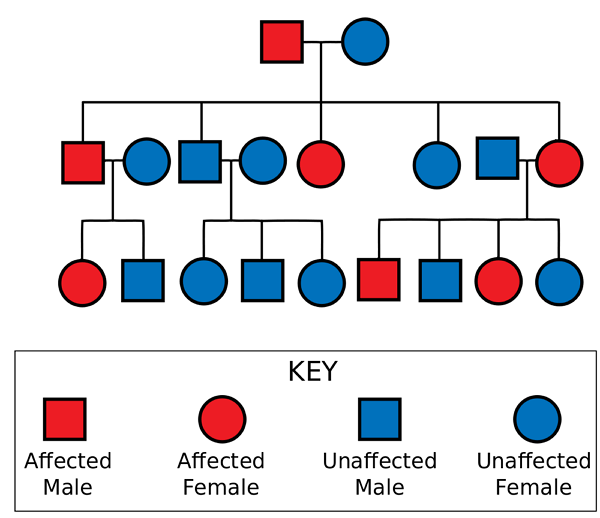
Image Source: hubpages.com
As you can check out from the image above, it’s presented mostly in the form of a readable chart, filled up with standard symbols, whereby squares represent males, and circle denotes females.
People, who wish to study the presence of a genetic condition in a family and determine the chances of a newborn having a particular genetic disorder, usually resort to pedigree diagrams in real life. Apart from humans, the same finds application in selective animal breeding, whereby the chart plays a vital role in the breeding program, aimed to improve the desirable traits in them.
Benefits of Pedigree Charts
By now, you must have gathered an understanding of pedigree diagrams and their very purpose. But, if you haven’t quite grabbed knowledge about the benefits rendered by it, get them straight here.
- Represents complicated family information in a simple and readable format.
- Proves useful in genetic study.
- Helps track genetic diseases running in one’s family.
- Anticipate the probability of a child receiving a particular genetic disorder.
- Proves valuable in animal breeding.
- Assists people, who choose to infuse certain traits in animals through a well thought out breeding program.
Family Tree VS Genogram VS Pedigree Chart
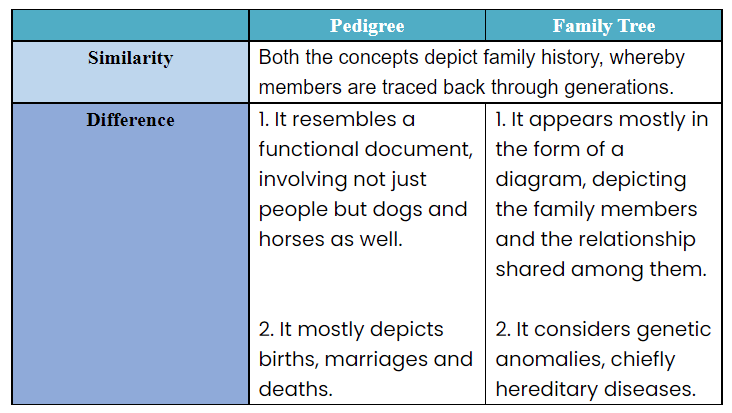
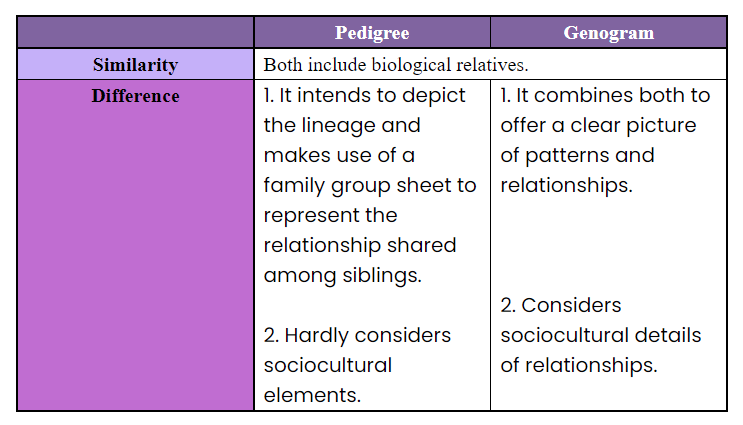
Given the benefits promised by pedigree analysis, one is often encouraged into the same, but only after clearing up of confusion. The latter is often felt by people who mix up the concept with a family tree and genogram.
Since the subject of the article is a pedigree diagram, let’s draw a comparison chart of the same against a family tree at first and genogram later.
Sometimes, knowing things is easy by learning from others, but the only experience brings you closer to elements that you didn’t know! That’s where lies the key to your redemption. To be able to chase the “things I don’t know,” enterprises can identify the emergence of a risk that may be invisible on the surface level.
Pedigree Chart VS Family Tree
Pedigree Chart VS Genogram
Examples of Pedigree Charts
Let’s consider two pedigree chart examples, one of a dog and the other of a human, to understand the concepts better. We bet going through them would strengthen your knowledge.
Example 1: Pedigree Analysis of a Dog
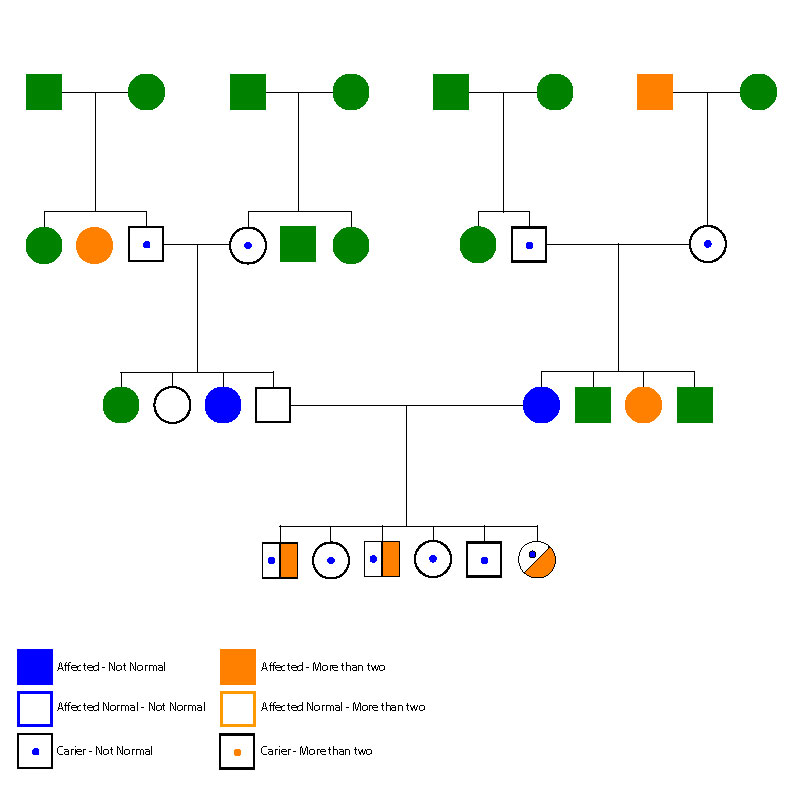
Image Source: breedingbetterdogs.com
Typically, it’s used up by breeders to study temperament, health and exclusive traits of a dog. Before starting, let’s make it clear that the diagram captures the strengths and weaknesses of litter-mates and their ancestors. A close look at the same would ultimately help you improve certain traits in the offspring and eliminate the problem areas.
What sets the diagram apart from others is the inclusion of littermates at all levels, except for the oldest generation. Using the same, one can easily extract the necessary information for suggesting improvements and minimizing issues.
Coming back to the elements used up in the diagram, as you can check out from the illustrated picture above, there are squares and circles, whereby the former represents males and the latter females. The rest you can easily make out from the labels given below the chart. As for designated shades, these portray certain disease or traits, whereas the repetition of anything speaks for patterns, which might have been passed on to the next generation.
Example 2: Human Pedigree Analysis
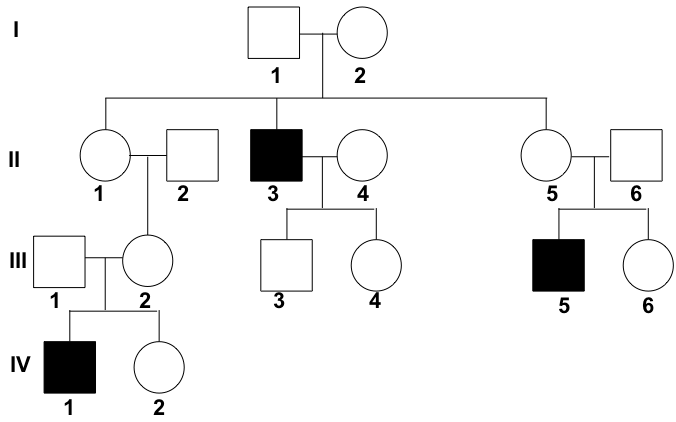
Image Source: khanacademy.org
Let’s take the case of X-linked recessive trait - color blindness and its inheritance under human pedigree analysis. If the chart represents the same, then it would appear somewhat like the diagram illustrated above. The Roman numerals on the left stand for generation, whereas the digits symbolize siblings. Only the topmost shapes indicate parents from which children branch out, and as discussed before, squares designate males, whereas circles stand for females. On the contrary, opaque black shapes denote the presence of the trait.
Now coming back to the explanation of the process, as you can check out, both the parents were free from the trait. But, one of their kids (II-3) suffer from color blindness. It suggests that the attribute is recessive, and the same seems to occur mostly in males of the family. You can get a hint of the same by looking at the diagram above, where only a few of the squares have an opaque finish. Others are free from it.
EdrawMax
All-in-One Diagram Software
- Superior file compatibility: Import and export drawings to various file formats, such as Visio
- Cross-platform supported (Windows, Mac, Linux, Web)
An Excellent Pedigree Chart Maker – EdrawMax
EdrawMax is a versatile software, simplifying the pedigree diagram making without taking professional help or breaking one’s bank. One of the many benefits of installing it in your system is convenience. Users need not leave their homely comforts to approach an expert for creating a chart. One can sit at home and design it by themselves and lend to it an expert touch. All you need to do is follow the steps below to complete the technical drawing successfully.
- First, finish your background research by collecting adequate information from your family. Also, decide how many generations you wish to include in the illustration. Don’t forget to keep it confidential!
- While there are two approaches to getting it done, namely free-hand and using a software i.e. EdrawMax, we suggest the latter, as it’s the best pedigree chart maker, offering future editing and storing functions altogether.
- Browse through Available Templates of the software to select your preferred pedigree design on the blank canvas.
- Explore the Page Layout tab to select a preferred layout and adjust the theme as well as the backdrop accordingly. You can further set margins and segregate the page for accuracy by exploring the View.
- Add standard vector symbols from the symbol library and drag and drop it to your blank canvas to create the outline. Insert text from the Home tab and customize it by accessing the Font
- Once it has done, you can save and export it in your preferred format. At EdrawMax, you can find SVG, JPG, MS Office, Visio and PDF formats at hand. Explore the Export & Send option to proceed in your chosen direction.
- You can even store it in the cloud by tracing Save As and then choosing Computer from the options offered.
So, the next time you plan to etch a pedigree diagram, don’t forget to take the assistance of this software to render a professional touch without exceeding your budget. EdrawMax can simplify your job and save you both time and money. Get started right away!
Edraw Content Team
You May Also Like
What is a Cladogram?
Knowledge


