Best Chart Software for Linux with Abundant Editable Chart Examples
Overview of Linux Chart Software
Edraw chart software for Linux is an all-inclusive chart maker. Users can create many types of charts with it, such as column chart, pie chart, area chart, pyramid chart, line chart, scatter chart and so on. It enables users to create professional and resourceful chart with just several minutes, no matter you are skilled or without any drawing skill.

System Requirements
Compatible with the most popular Linux distributions such as Debian, Ubuntu, Fedora, CentOS, OpenSUSE, Mint, Knoppix, RedHat, Gentoo and More.
Key Features of Chart Software for Linux
Here lists several superior features of our Linux chart software that preferred by most users. Welcome to download and try it for free.
- Affordable Price with Live Upgrade
- Marvelous Visualization
- Quick-Start Chart Symbols & Templates
- Enormous Data Insertion
- Share Chart as You Wish
The price of Edraw is much cheaper than most of chart makes works on Linux and users can enjoy a lifelong upgrade guarantee once buying a lifetime license.
It enables users to analyze the market effectively by visualizing market moves, potential breakouts and related numbers.
Users can create their chart with built-in chart symbols and professionally-designed chart templates instead of starting from scratch.
Edraw supports inserting hyperlinks, images, notes and attachments to make chart more impressive and keep audience engaged.
Multiple common file formats import & export and real-time collaboration makes chart share can be conveniently finished with one click.
Free Download Chart Software to Create Various Charts on Linux Easily:
Various Ready-made Chart Shapes for Linux Chart Design
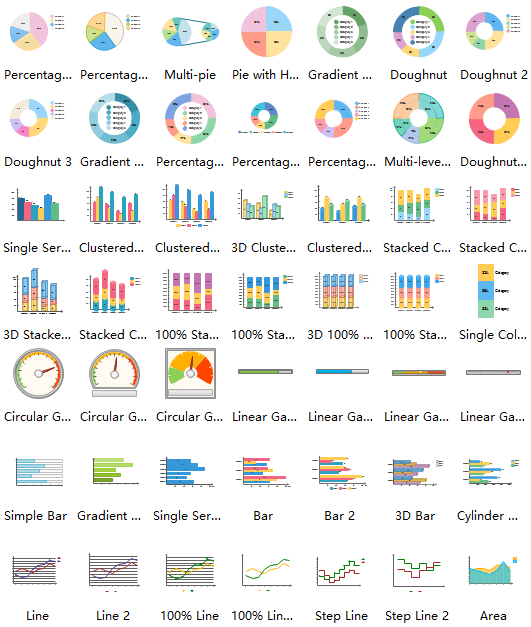
Abundant vector chart shapes are grouped into different chart types in the left libraries of Linux chart software. And all of them are royalty free, people can easily drag, drop and edit them as they wish. There is no need for users to worry about if they can not find the shapes they want cause Edraw has humanely prepared a set of drawing tool for them to free design.
How to Create Chart on Linux Easily
Creating chart on Linux can be extremely easy with Edraw since it has almost set everything ready. Let’s take area chart as an example.
- Start Edraw, go to File menu > New > Chart, and then double click area icon under templates window to open a blank drawing page.
- Drag an area chart shape from left libraries and drop on the drawing page. Edit the data to fit your needs. Area will be changed according to the data change.
- Go to the right sidebar and set the area color to make them more visual. Users can also navigate to Page Layout and change the theme if necessary.
- Click Save on File tab to save the area chart as default .eddx format; or hit Export & Send under File to export it to common formats for sharing conveniently.
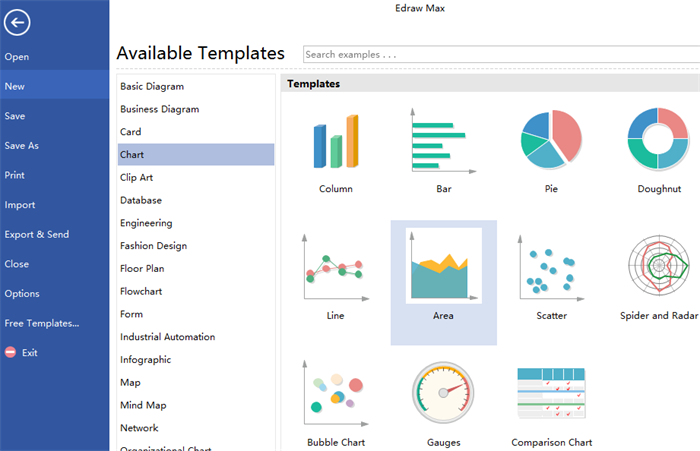
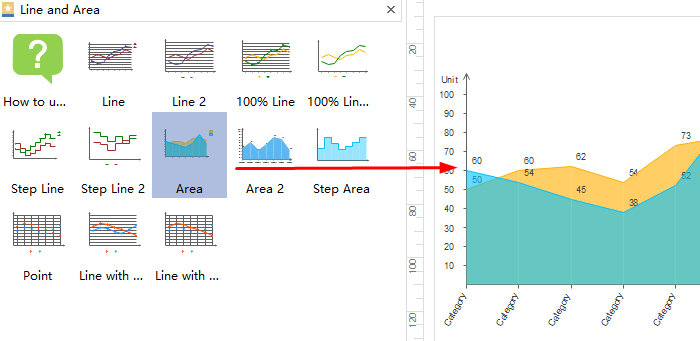
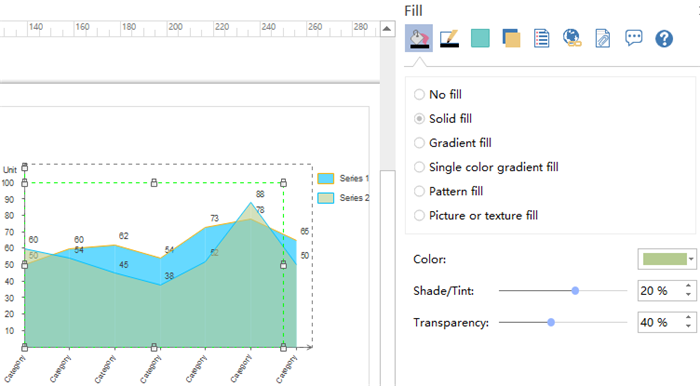
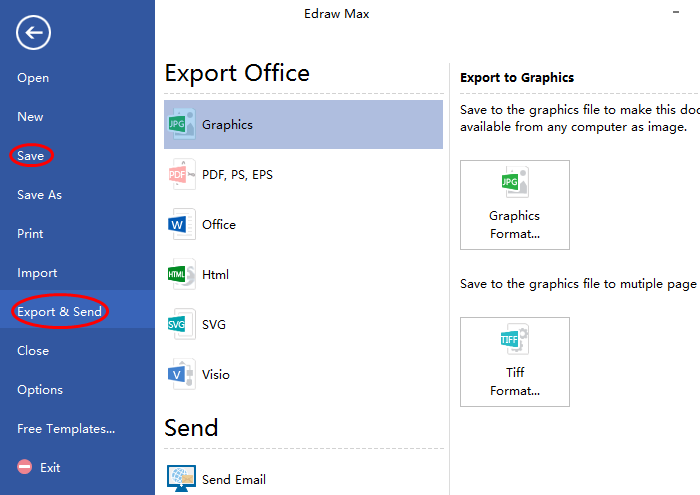
Chart Examples Created by Linux Chart Software
Following are chart examples created by our chart software for Linux. All the examples are different chart types and free to download & customize. Users can download them and learn to create their own charts.
5W Chart
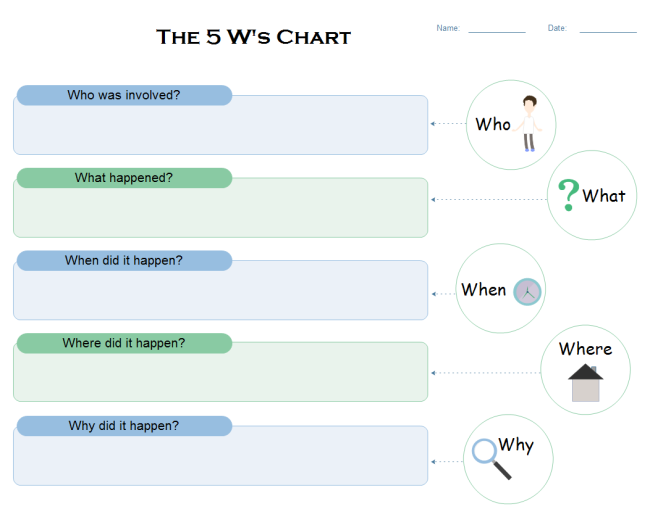
The first one is 5W chart. It is one of the most useful chart in helping cultivate the logical thinking of students. Teachers can list out the all 5W: Who, What, When, Where and Why, then the whole thing is obvious right now.
Spider Chart
The second one is a performance appraisal spider chart. It is suitable for company owners to evaluate the performance of his employees from different aspects.
Pyramid Chart
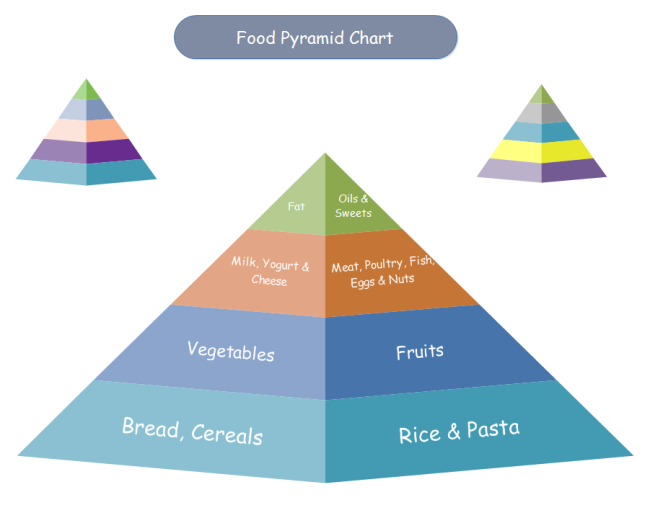
The third one is an exquisite food pyramid chart. People can easily know what kind of food should be ate more from it.
Related Articles:
All-Inclusive Home Electrical Plan Software for Linux
Office Layout Software for Linux - Makes Office Planning Simply
Stylish Fashion Design Software for Linux - Design Your Own Fashion
Presentation Software for Linux - Create Seamless Presentation in Your Way
