5 Best Science Diagram Makers
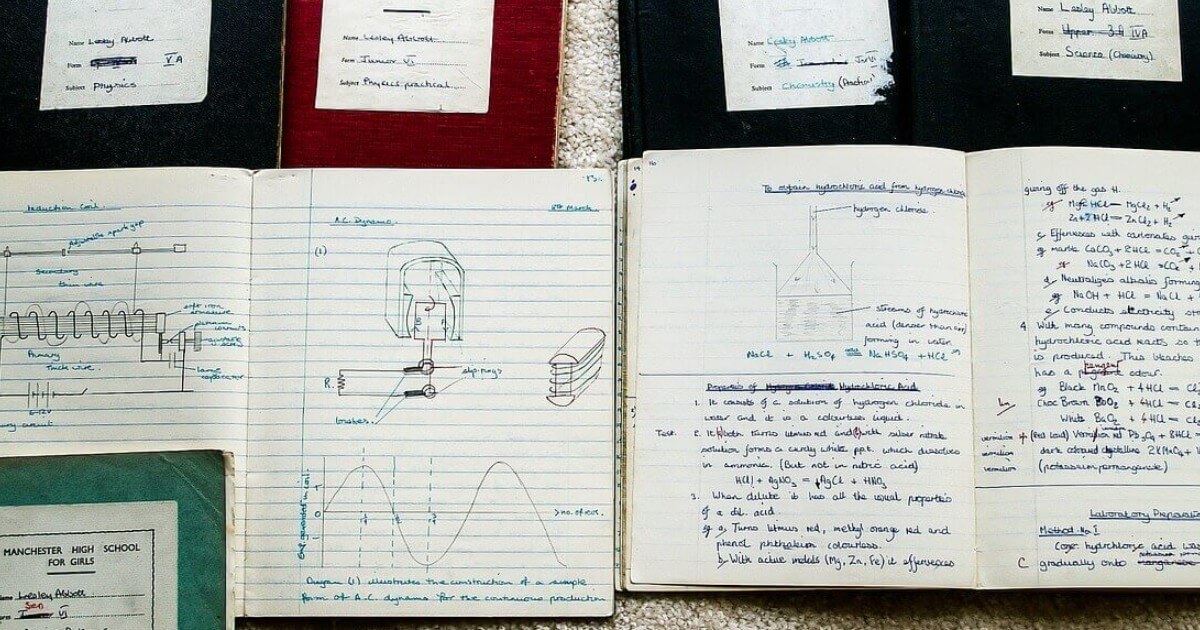
Illustrations and diagrams are pivotal for scientific know-how, and for your diagrams alone, you can earn a handsome amount of credits on science projects and dissertations. But there is a catch! Even if you have the whole idea about a paradigm, drawing and diagramming needs a different level of skill set, and things can be cumbersome if you don’t have proper tools.
To be able to create neat, expert diagrams in minutes is any day better than wasting hours on word processors or image editors to achieve a basic layout of the idea justly.
That’s the point of having a scientific diagram maker to make things easier. Today, there are tons of software that facilitate the dynamic needs of scientific diagramming, with ready to use tools and templates. But different software acts differently, so it takes a wee bit of research to signify the essentials according to its utility. Here are some of the best suites for the cause.
What are the Benefits of Science Diagrams?
- Out-of-sight things such as the “process of photosynthesis” would otherwise inspire people to picture it differently if there wasn’ t a justified visual example to make it even.
- Visible things such as parts of machinery, the study of anatomies, or different scales of geographic mapping, all the precise illustrations can be streamlined by the simulation of definitive diagrams to make it easier to process.
- Science texts, especially mathematical chapters, can have heavy use of compound words that each carry extensive functions. The diagrams can be a leveler at times for being the most perceptible language of all.
- Clear lines and shapes make it easy to comprehend intertwined aspects by bridging a gap between preconceived notions and actual comprehension about the mass, volume, and truth of a matter.
- Diagrams are easier to relate to and thus are easy to remember, that is the last piece of a puzzle to transform data into knowledge.
What to Consider before Choosing a Science Diagram Maker?
It might seem that given a common cause, all scientific diagram makers would be more or less the same. But that's not entirely true. Other than the basic shapes, templates, and resources, there many things matter after all, like how easy it is to use, is it more ideal for school kids, or can be used on a professional level, etc. Rounding it off, here are five things to consider before you choose a science diagramming software:
Expertise - The usage fields of science diagram software is made up of standard and advanced options, including diverse subjects like mathematics, physics, biology, etc.
Level - Some suites are created focally for school students, and ones that are much more sophisticated and complex meant for professionals and experts. There are some rare products that account for dynamic usability that can be used by the entire family. What should you opt for?
Cost - There is software that offers a host of features on their free versions, and ones that come as a one-time purchase, that doesn't need any sort of renewals. There are rare ones that offer both. Determine what you are paying for. If you are looking for long term use, having a one-time purchase with providing extensive resources would be more cost-effective. Do the math.
Tech Specs - Some users prefer a downloadable suite while some like to keep things on the cloud. And some still use Linux systems. And there is software that offers all accessibilities seamlessly. So consider reviewing the tech specs and compare how well it addresses your way of use, how well it supports your device and OS, and how much space-occupying it is.
User Interface - The most important is the workflow. Some interfaces of software read your mind and direct you in the right direction with all the buttons close at hand and being omnipresent for mobile and desktop use. You can simply drag and drop elements on your worksheet, share instantly, and export seamlessly without much ado. You got to have that rapport with the software when you can avail of it.
Best 5 Science Diagram Makers
1. EdrawMax
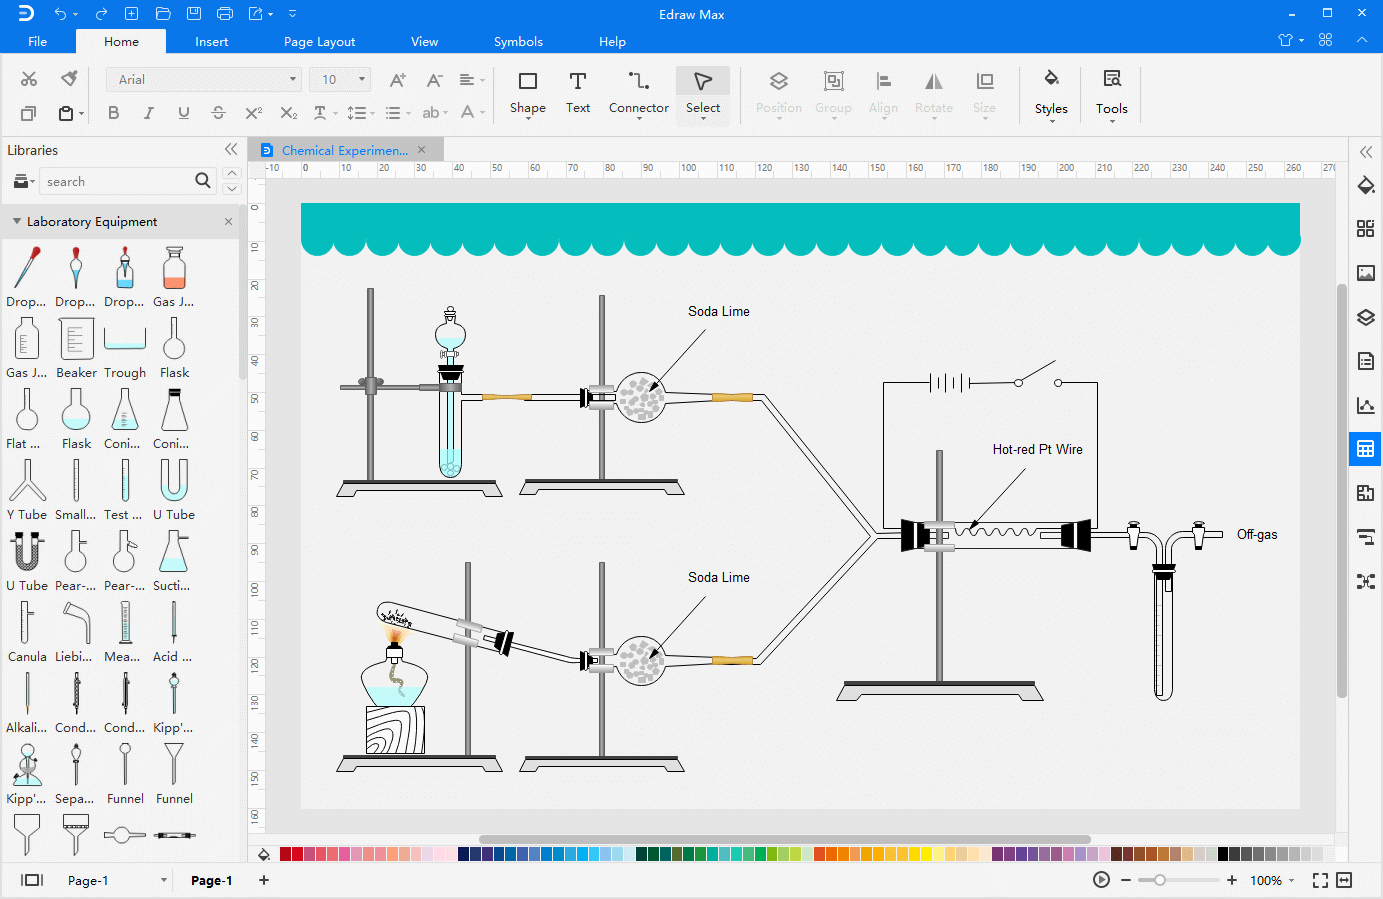
The first one in our list of scientific illustration software is EdrawMax, which is powered by EdrawSoft. The best thing about this software features an extensive range of science diagram templates, including physics, chemistry, mathematics, biology, engineering, and what not! Easy to use ‘drag and drop’ and pen drawing features makes it easy to use for both school kids and high profile scientists. What’s more, it offers a free trial that supports Windows, Mac OS, and Linux, plus it provides a cloud-based interface too. Purchasing this goodie is a one-time investment.
Supported Platforms: Mac OS X, Windows, Linux as well as the online Version.
Price: Variety of pricing plans for individuals, non-profit organizations, and businesses. Prices start from $99. You can also have a free trial that offers a decent set of resources.
Scores from Capterra: 4.6 / 5.
Link: https://www.edrawsoft.com/edraw-max/
2. Chemix
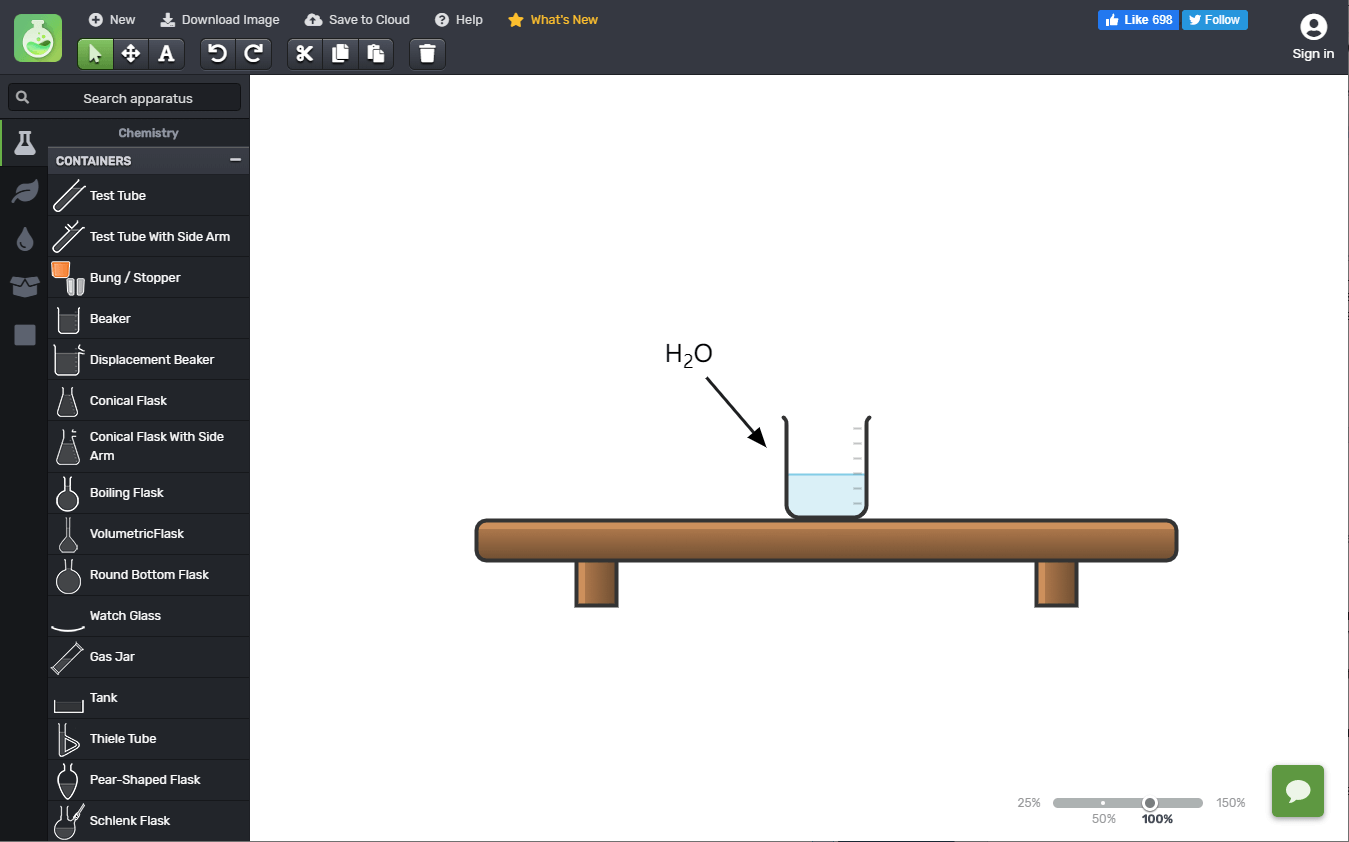
If you are looking for a basic, free to use software for mainly Lab Diagrams for pupils or kids curriculum, Chemix can be an ideal resource. Created by Micron Developers, Chemix offers flat, line drawings and a basic set of diagrams of chemical apparatus with elementary customization options, with no download and no registration accessibility.
Supported Platforms: Web-Based
Price: Free.
Scores from Capterra: N/A
Link: https://chemix.org/
3. SmartDraw
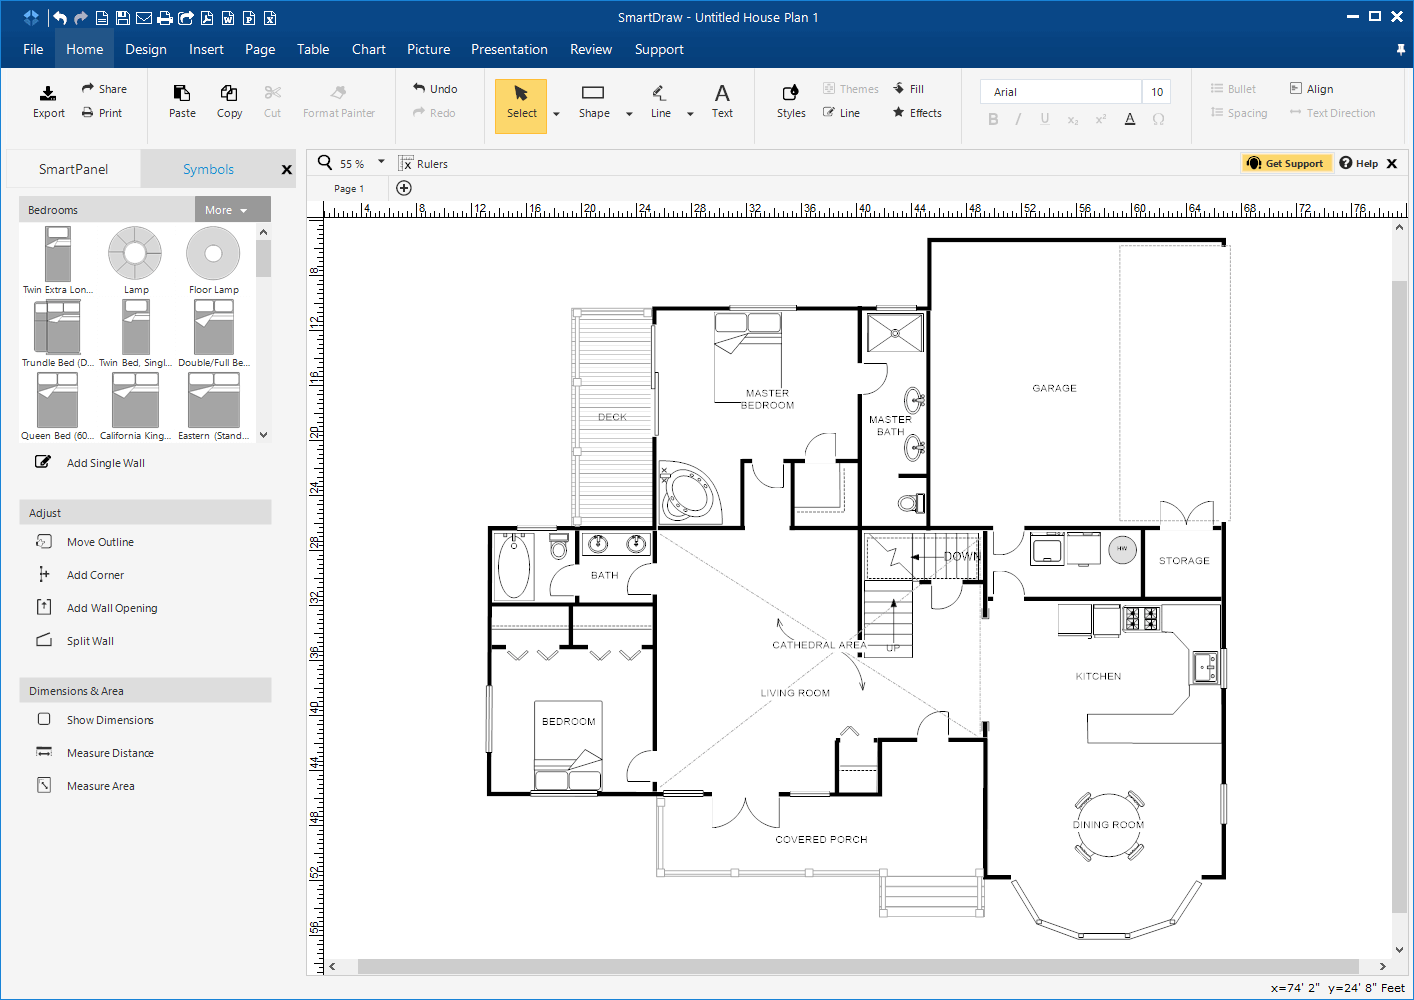
SmartDraw is an excellent diagramming software that mainly works with different kinds of charts based diagrams, that can be heavily used for creating chemistry and mathematical illustrations, also CAD drawings and Organizational Charts and much more. It offers thousands of ready to use templates that can work out for scientific illustrations, engineering projects in both academic and professional level.
Supported Platforms: Mac OS, Windows, Linux, Mobile as well as the online version
Price: Online version costs $9.95/month - paid annually; The desktop version requires $297.
Scores from Capterra: 4.1/5
Link: https://www.smartdraw.com/
4. BioRender
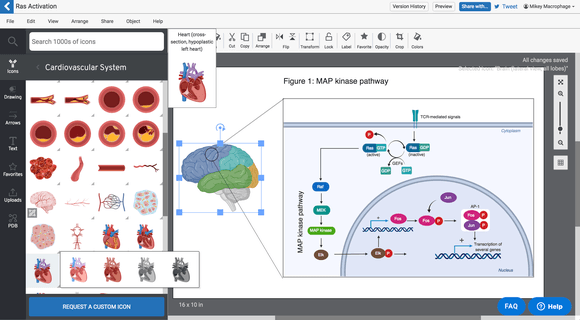
BioRender is a powerful science diagram maker software that offers over 20,000 icons and images mainly centric to Biology and Life Sciences. This is web-based software and is capable of providing high-quality diagrams ideal for University papers and professional content.
Supported Platforms: Web-Based
Price: Varying suites start from $35 per month, paid annually.
Scores from Capterra: N/A
Link: https://biorender.com/
5. Mind the Graph
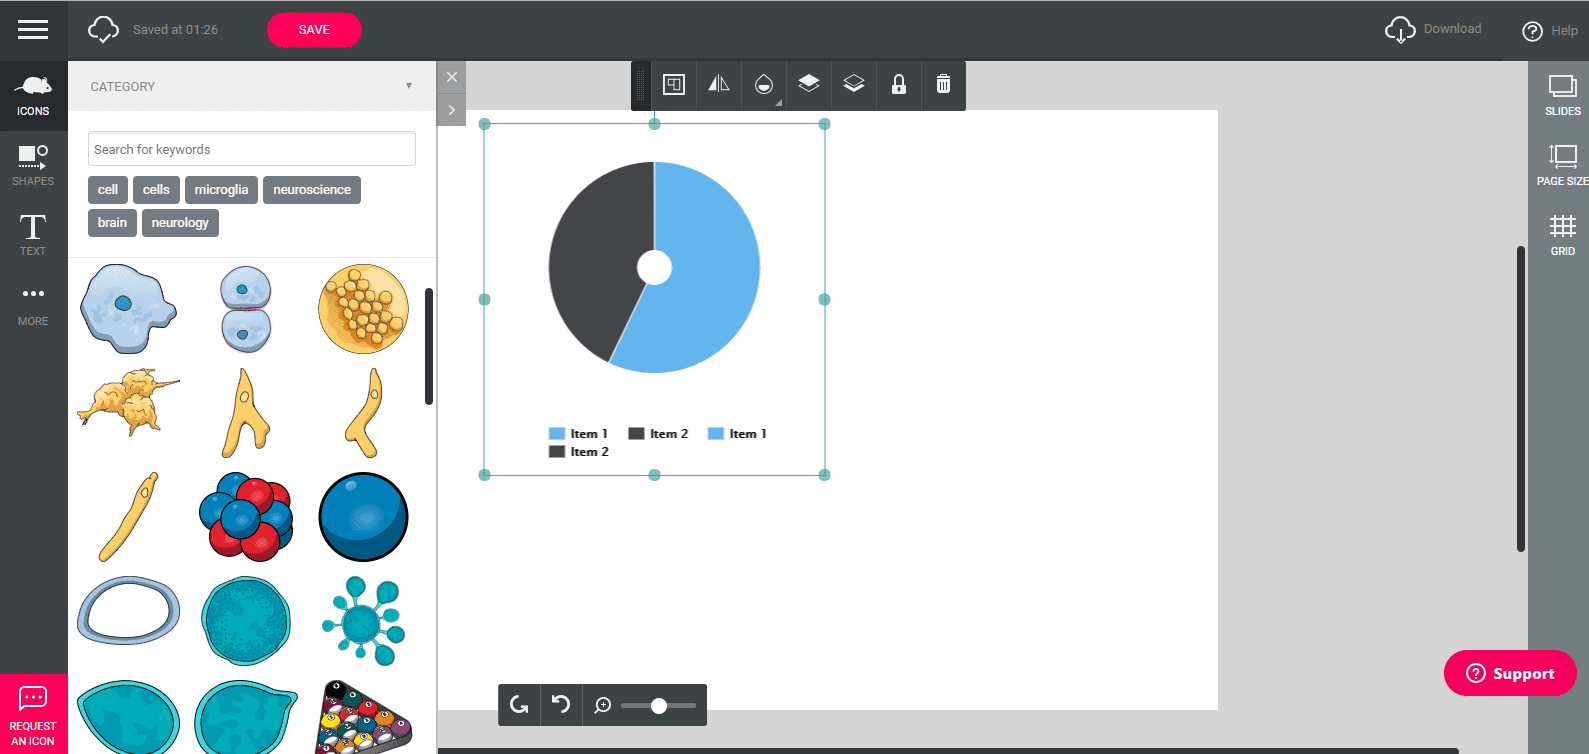
Mind the Graph is an infographics maker focused on science diagram and illustration that is ideal for creating posters, slides, and fliers for awareness and interactive content. It offers colorful ready to use templates and extensive customization tools.
Supported Platforms: Mac OS, Windows, Linux, Mobile as well as the online version
Price: Free for the Beginner plan and you can pay annually or monthly for premium plans.
Scores from Capterra: N/A
Link: https://mindthegraph.com/
Final Word of Advice
For stuff like scientific diagram maker, it is really a personal choice, that depends on how you wish to use the thing. But if you are buying it for your school going kid, then consider that it is better to have a progressive suite that they can use throughout their academic career and also professional level, especially if they are pursuing science stream.